
Blog
Account-Based Marketing vs. Inbound Marketing: Which Fits Your B2B SaaS Stage?
ABM optimises for pipeline per named account; inbound optimises for lead volume. Get a clear verdict by ACV and sales cycle length for B2B SaaS teams.
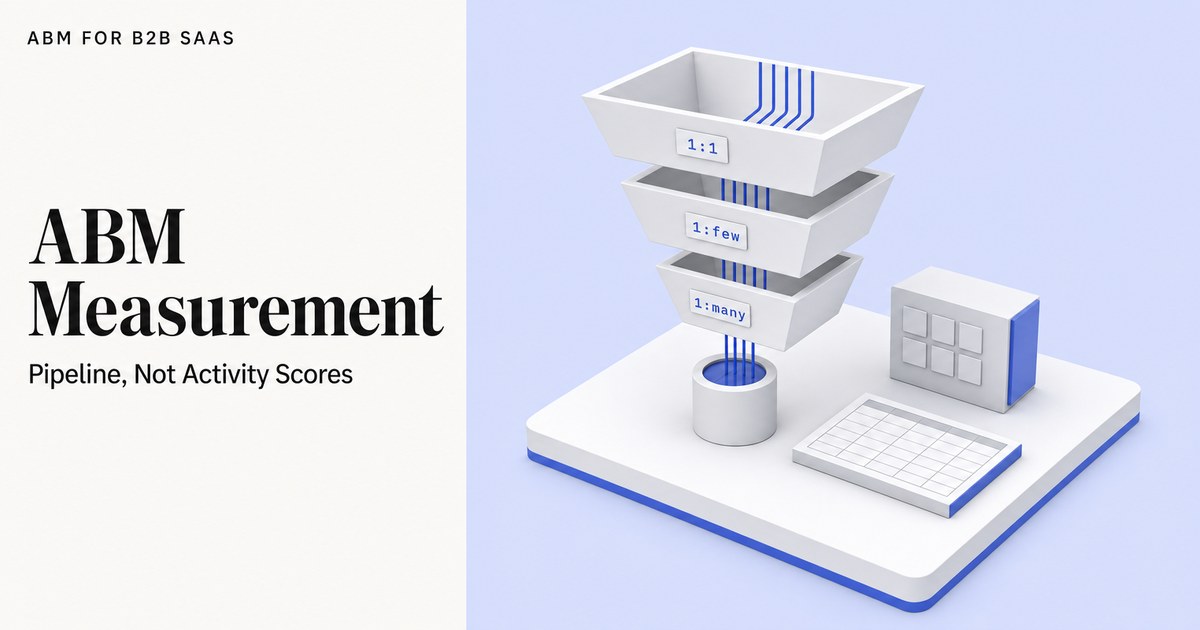
Stop tracking engaged accounts. Rebuild ABM measurement around account-to-opportunity rate and pipeline per target account, tiered by 1:1, 1:few, and 1:many.
ABM optimises for pipeline per named account; inbound optimises for lead volume. Get a clear verdict by ACV and sales cycle length for B2B SaaS teams.

Define where B2B SaaS demand generation ends and ABM begins, by deal size and channel. Includes thresholds, channel mix, and pipeline metrics.
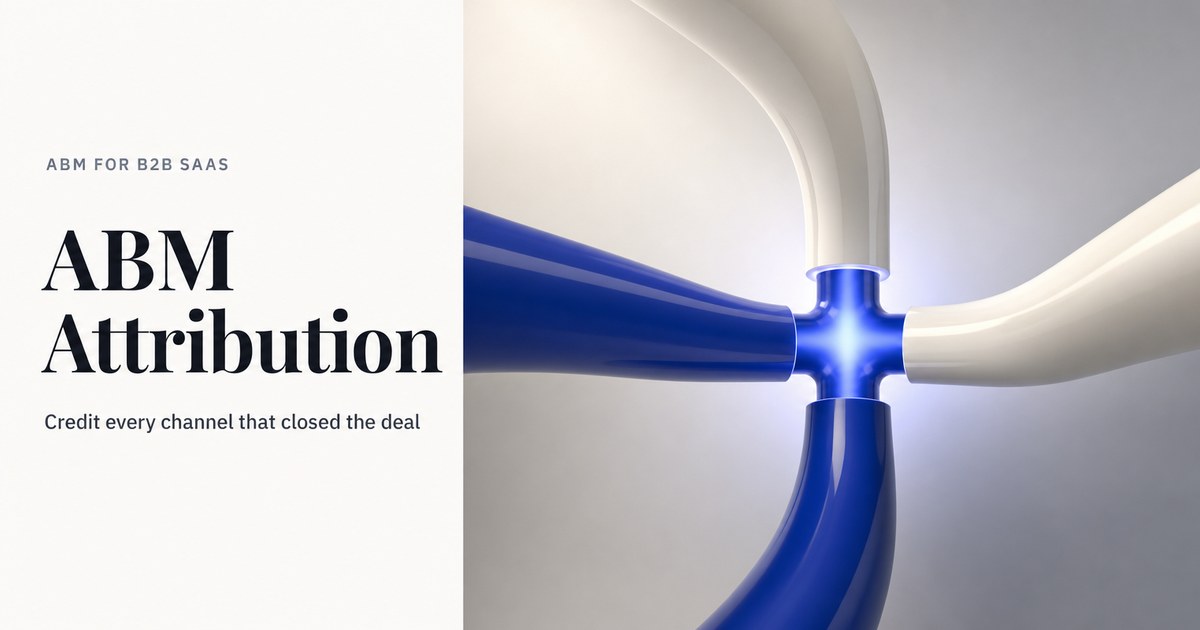
When LinkedIn, email, and sales outreach all touch the same account, standard attribution misses most of the story. Learn account-level attribution that works.
Request a quote and our experts will contact you within 24 hours with tailored solutions and pricing.
Last updated: Oct 21, 2026
By ABM for B2B SaaS Editorial Team
Account-based marketing (ABM) measurement is the practice of tracking whether a program is creating pipeline and opportunities at named target accounts, not simply reaching or engaging them, and the two metrics that determine whether it is working are account-to-opportunity rate and pipeline per target account.
When a dashboard shows 600 accounts engaged and sales says nothing has changed, the measurement model is broken. That gap is not a program failure. It is a metrics failure. Engagement scores and accounts-reached counts tell you what ran. They do not tell you what it produced. This guide rebuilds ABM measurement around the metrics that actually connect to revenue, explains how measurement should differ across 1:1, 1:few, and 1:many tiers, and offers working guidance on meeting-booked rate benchmarks by tier.
Key Takeaways
- Account-to-opportunity rate and pipeline per target account are the primary ABM outcome metrics. Engagement scores and accounts reached are activity metrics, not revenue signals.
- A holdout group of matched accounts that received no ABM treatment is the only way to isolate what the program contributed above normal sales activity.
- Measurement depth should match the tier: per-account tracking for 1:1 programs (10-50 accounts), cluster-level tracking for 1:few (50-200 accounts), aggregate tracking for 1:many (200-500 accounts) - published ranges, no sample stated (GrowthSpree, June 2026).
- Sales cycle length sets the minimum evaluation window. As of mid-2026, published ranges are: 49-84 days for $25K - $100K deals, 84-126 days for $100K - $250K deals, and 126-180 days for $250K - $1M deals (GrowthSpree [BC26], published ranges, no sample stated).
- A customer relationship management (CRM) platform with a named-account list and an opportunity record is sufficient for core ABM measurement. No dedicated ABM tool is required to start.
Activity metrics such as accounts reached, engagement scores, and ad impressions measure what an account-based marketing program did, not what it produced. A program can show 600 engaged accounts while creating zero new opportunities, because engagement does not require intent to buy. In GrowthSpree's June 2026 audit of 56 LinkedIn accounts ($9.4M analyzed), decision-makers received only 33% of ad budget against a target of 60% or more - and even that reach did not appear in pipeline without outcome tracking.

GrowthSpree's June 2026 audit (56 LinkedIn accounts, $9.4M in ad spend analyzed): Decision-makers received 33% of LinkedIn ad budget against a 60%-or-higher target. Non-buying job functions caused 30% of wasted spend. Individual contributors and entry-level staff consumed 36% of budget.
Those numbers describe a reach problem. But the measurement problem runs deeper: even when ads do reach the right people, the standard dashboard reports impressions and engagement, not what happened at the account afterward. Impressions at the right contact are still not pipeline.
LinkedIn Marketing Solutions defines account-based marketing as a strategy that aligns marketing and sales to focus on high-value accounts. That alignment is only measurable if the metrics sit at the account level, not the impression or click level.
Three outcome metrics displace engagement dashboards:
Without a holdout group, it is impossible to separate ABM's contribution from sales activity that would have happened anyway.
A sound ABM measurement framework tracks four outcome metrics tied to revenue: account-to-opportunity rate, pipeline per target account, cost per sales-qualified lead (SQL) by tier, and win rate on ABM-sourced opportunities. Each metric is calculated at the account level from CRM data and compared against a matched holdout group of accounts that received no ABM treatment, isolating what the program contributed above a normal sales baseline.
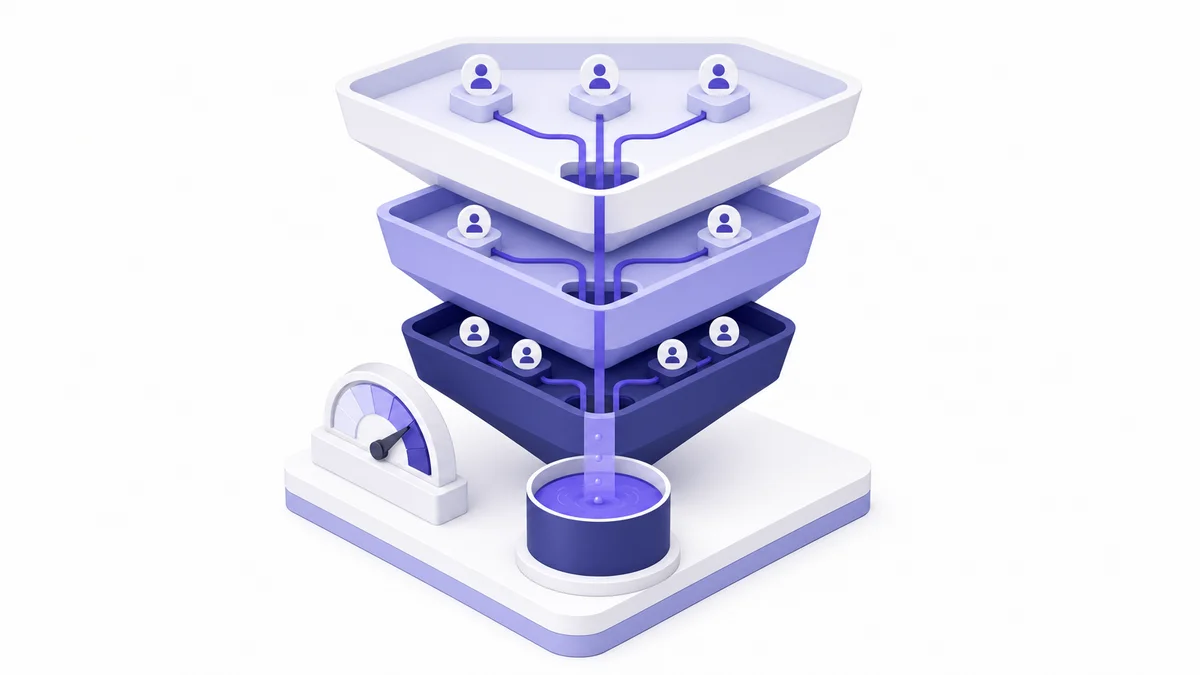
Sales-qualified lead (SQL) is a prospect that sales has reviewed and accepted as meeting the criteria to be worked as an active deal opportunity. Cost per SQL by tier shows whether the program is operating within the economics of the deal size it targets.
Annual contract value (ACV) is the average revenue per customer contract on an annualized basis. It sets the ceiling on what a program can spend per SQL and determines which ABM tier is financially viable. As of April 2026, published benchmark ranges for target cost per SQL by ACV band are (GrowthSpree [B26], published ranges, no sample stated):
| ACV Band | Target Cost per SQL | Typical Stakeholder Count | Typical Cycle Length |
|---|---|---|---|
| $15K - $50K | $1,000 - $3,000 | 5-8 stakeholders | 49-84 days |
| $50K - $150K | $3,000 - $8,000 | 7-10 stakeholders | 84-126 days |
| $150K+ | $8,000 - $20,000 | 10-15 stakeholders | 126-180 days |
Sources: Cost per SQL from GrowthSpree [B26], April 2026. Stakeholder and cycle ranges from GrowthSpree [BC26], as of mid-2026. All published ranges, no sample stated.
The stakeholder counts matter for measurement timing. A $250K deal with 10-15 stakeholders and a 126-180 day cycle cannot be evaluated for pipeline contribution after 30 days. Setting the evaluation window shorter than the sales cycle makes the program look ineffective before it has had time to produce results.
Salesforce describes account-based marketing as requiring sales and marketing alignment at the account level - which is exactly what this five-field CRM setup produces:
That five-field report answers the question sales and leadership actually ask: did this program create pipeline that would not have existed otherwise?
Account-based marketing (ABM) measurement should match the depth of treatment each tier receives. For 1:1 accounts (published ranges: 10-50 accounts), track account-to-opportunity rate and pipeline per individual account. For 1:few clusters (50-200 accounts in 5-15 groups), track opportunity rate and pipeline per cluster. For 1:many (200-500 accounts), track aggregate pipeline and cost per SQL. Applying 1:1 measurement precision to a 1:many program produces unreliable signals in both directions.
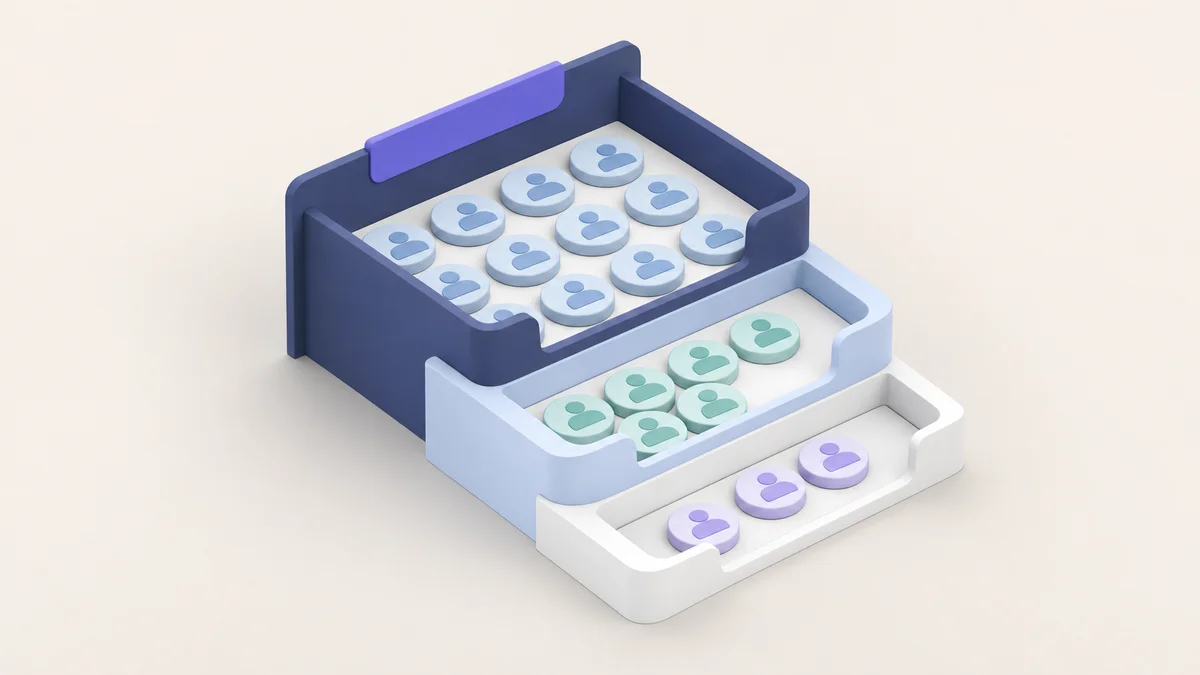
1:1 ABM dedicates bespoke content and outreach to each individual account, typically reserved for the highest-value targets. Published ranges suggest 10-50 accounts at this tier (GrowthSpree [ABM26], June 2026, practitioner view, no sample stated). The measurement unit at this tier is the individual account: track every stakeholder touched, every meeting booked, and every deal stage movement per account.
1:few ABM groups accounts with shared characteristics into clusters, covering 50-200 accounts across 5-15 clusters (GrowthSpree [ABM26], June 2026, practitioner view, no sample stated). The measurement unit is the cluster: opportunity rate and pipeline are tracked per cluster, not per individual account.
1:many ABM applies programmatic tactics across a named-account list of 200-500 accounts (GrowthSpree [ABM26], June 2026, practitioner view, no sample stated). The measurement unit is the program aggregate: total pipeline, total SQLs, and cost per SQL across the full list.
Most ABM programs fail the measurement test because they apply 1:many list sizes to 1:1 reporting. As of June 2026, common account lists run 500 to 2,000+ named accounts at companies that should operate lists of 100 to 300 (GrowthSpree [ABM26], practitioner view, no sample stated). When the list is too large for the team, per-account signals become too thin to interpret.
GrowthSpree's June 2026 analysis (published ranges, no sample stated): Recommended tier sizes are 10-50 accounts for 1:1 treatment, 50-200 accounts in 5-15 clusters for 1:few, and 200-500 for 1:many. Common lists run 500 to 2,000+ at companies that should run 100 to 300.
| Tier | Typical Account Count | Primary Measurement Unit | Key Metrics |
|---|---|---|---|
| 1:1 | 10-50 accounts | Individual account | Account-to-opportunity rate, pipeline per account, stakeholder coverage |
| 1:few | 50-200 accounts (5-15 clusters) | Cluster | Opportunity rate per cluster, pipeline per cluster, meeting-booked rate |
| 1:many | 200-500 accounts | Program aggregate | Total pipeline, cost per SQL, aggregate opportunity rate |
Published ranges, no sample stated (GrowthSpree [ABM26], June 2026).
No published benchmark with a stated sample exists for ABM meeting-booked rates by tier. Practitioner working ranges, derived from published tier sizes and deal-cycle lengths and offered here as author estimates only, are: 20-30% per quarter for 1:1 programs (10-50 accounts, bespoke outreach); 10-20% for 1:few clusters (50-200 accounts); 5-10% for 1:many programs (200-500 accounts). These are not study findings.
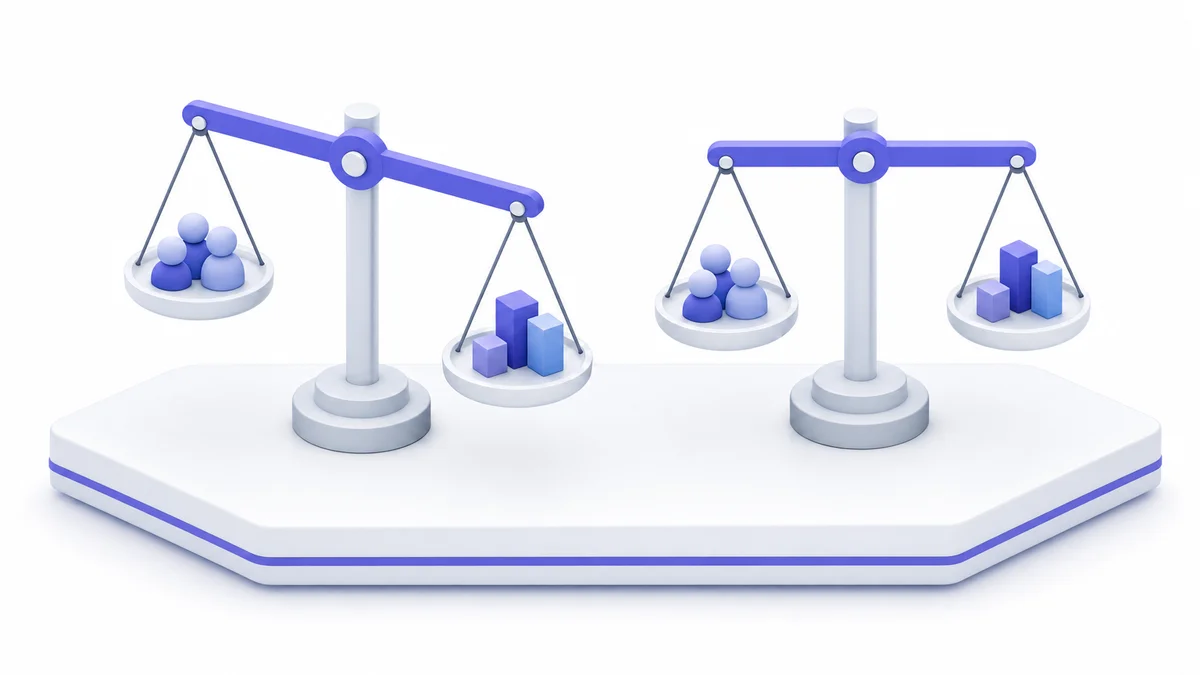
The logic behind these ranges: a 1:1 program commits bespoke outreach to each account, so the ratio of effort to accounts is high and a 20-30% booked-meeting rate is a reasonable target. A 1:many program spreads lower-touch outreach across hundreds of accounts, so a lower rate is expected and acceptable. The absolute rate matters less than the trend within each tier over time.
The right calibration point for any program is its own sales cycle length. As of mid-2026, published deal-cycle benchmarks are (GrowthSpree [BC26], published ranges, no sample stated):
A meeting-booked rate measured after 30 days on a program selling $250K deals with a 180-day cycle tells you almost nothing. Evaluate meeting-booked rate only after at least one full sales cycle has completed.
Meeting-booked rate is a leading indicator, not an outcome metric. A booked meeting shows that outreach reached someone willing to engage. It does not show that the account will become an opportunity. Treat it as a signal to investigate further, not as a metric to report to leadership as evidence of pipeline.
For leadership reporting, the only metrics that answer the revenue question are account-to-opportunity rate, pipeline per target account, and cost per SQL by tier, compared against the holdout group.
The best ABM measurement tool for account-based marketing is the one that tracks account-to-opportunity rate and pipeline per target account at the account level, and most customer relationship management (CRM) platforms can do this without a dedicated ABM tool. A CRM with a named-account list, an opportunity record, and a pipeline field is sufficient for core ABM measurement. Dedicated ABM platforms add intent signals and multi-touch attribution, but neither capability replaces the two primary outcome metrics.

Customer relationship management (CRM) is a platform that records account, contact, and deal data. It is the minimum infrastructure for ABM measurement because it holds the account list, the opportunity record, and the pipeline value in one place.
The decision to add a dedicated ABM platform should not be made on measurement grounds alone. The framework described here runs on a CRM. If deal size and team size justify a platform, that platform adds operational leverage, not measurement legitimacy.
| Capability | CRM Only | Dedicated ABM Platform |
|---|---|---|
| Account-to-opportunity rate | Yes | Yes |
| Pipeline per target account | Yes | Yes |
| Holdout group tracking | Yes (manual) | Often automated |
| Intent signal tracking | No | Yes |
| Multi-touch attribution | Partial | Yes |
| Engagement scoring | No | Yes |
| Stakeholder mapping | Manual | Varies by platform |
An ABM program can measure account-to-opportunity rate and pipeline per target account with three tools:
That combination answers the question that matters to leadership: is the program creating pipeline that would not otherwise exist?
ABM measurement built around account-to-opportunity rate is not appropriate for every program. It requires an annual contract value (ACV) above $15K, a dedicated seller working named accounts, a sales cycle long enough to observe outcomes (typically 30 days or more), and a CRM that records opportunities at the account level. Below that ACV threshold, the cost of per-account tracking rarely justifies the program, and the per-account data volume is too thin to produce reliable signals.
Programs where this approach will not work reliably include:
Ideal customer profile (ICP) is a description of the company type, size, and characteristics most likely to buy and retain a product. ICP fit is a prerequisite for this framework, not a measurement output. If the account list was built on firmographics alone rather than fit and intent, the measurement framework will surface poor results accurately. No measurement framework fixes a list that should not have been built.
Account-based marketing (ABM) measurement should match the depth of treatment each tier receives. For 1:1 accounts (10-50 accounts), track account-to-opportunity rate, pipeline per account, and stakeholder coverage per deal. For 1:few clusters (50-200 accounts in 5-15 groups), track opportunity rate per cluster and meeting-booked rate. For 1:many (200-500 accounts), track aggregate pipeline created and cost per sales-qualified lead (SQL) by tier. Applying the same metrics across all three tiers produces misleading results in both directions.
Engagement scores and accounts-reached counts are activity metrics that do not predict revenue. Replace them with three outcome metrics: account-to-opportunity rate (what share of target accounts became an open opportunity), pipeline per target account (total pipeline value divided by accounts in the program), and meeting-booked rate per tier. Compare results against a holdout group of matched accounts that received no ABM treatment to isolate the program's contribution above baseline.
Pull every target account from your CRM and tag whether an opportunity was created. Divide the number of accounts with a created opportunity by total accounts in the program: that is your account-to-opportunity rate. Then sum open and closed pipeline for those accounts and divide by total account count to get pipeline per account. Run the same calculation on a matched holdout set to show what ABM contributed above baseline.
Leadership metrics for account-based marketing (ABM) reporting are: account-to-opportunity rate, pipeline per target account, cost per sales-qualified lead (SQL) by tier, and win rate on opportunities sourced from the ABM account list. A holdout comparison makes the pipeline contribution clear. Avoid reporting engagement scores, ad impressions, or accounts reached as primary metrics - they do not answer whether ABM created revenue.
No published benchmark with a stated sample exists for ABM meeting-booked rates by tier. As practitioner working ranges, derived from published tier sizes and deal-cycle lengths and offered as author estimates only: 1:1 programs (10-50 accounts, bespoke outreach) should target 20-30% per quarter; 1:few clusters (50-200 accounts) should target 10-20%; 1:many programs (200-500 accounts) should target 5-10%. These are not study findings - calibrate against your own sales cycle before setting internal targets.
Account-based marketing measurement fails when programs report activity instead of outcomes. The fix is specific: replace engagement scores and accounts-reached counts with account-to-opportunity rate, pipeline per target account, cost per SQL by tier, and holdout-adjusted pipeline.
Apply the measurement depth that matches each tier: per account for 1:1, per cluster for 1:few, aggregate for 1:many. Set the evaluation window to at least one full sales cycle. Treat meeting-booked rate as a leading indicator, not a leadership metric.
A CRM with a named-account list and an opportunity record is enough to start. The framework does not require a dedicated ABM platform. What it requires is discipline: tagging accounts, maintaining a holdout group, and pulling account-level data every cycle.
If your ABM account list or measurement setup needs a second set of eyes, a free consultation is available. Bring your target account list and brainstorm the next step with an ABM expert.
Meet with an expert
© 2026 abmforb2bsaas.com All rights reserved.