
Blog
Attribution Models for B2B SaaS: What Each Measures and Where It Fails
Attribution models compared by deal size, sales cycle and buying group. What first-touch, last-touch, U-shaped and W-shaped each measure and where they fail.
Which ABM benchmark metrics to report to a board: account-to-opportunity rate and pipeline per target account against holdout accounts. Plus a 90-day plan.
 Ishan ManchandaNov 12, 2026

Attribution models compared by deal size, sales cycle and buying group. What first-touch, last-touch, U-shaped and W-shaped each measure and where they fail.
Published ranges for splitting B2B SaaS marketing budget across ABM, demand generation, and brand, with sources, sample status, and a tier-first method.
Fix account based marketing LinkedIn targeting: measure waste, exclude non-buyers, cover the buying group and scale from 50 to 200 target accounts.
Request a quote and our experts will contact you within 24 hours with tailored solutions and pricing.
Last updated: Nov 12, 2026
By ABM for B2B SaaS Editorial Team | Last updated October 28, 2026
ABM benchmark metrics are the account-level numbers a board can compare over time, led by account-to-opportunity rate and pipeline per target account measured against holdout accounts, with engagement scores kept as operating metrics. Account-based marketing (ABM) focuses sales and marketing on a defined list of named companies, so the proof has to be account-level too.
The scene is familiar. A funding round closes, the board sets an enterprise pipeline target, and the first question is which numbers to show. A dashboard reading "600 accounts engaged" will not survive that meeting if sales says nothing changed. This guide covers which metrics to report, how to design a holdout, which published benchmarks are usable, and how to lay out the first board slide. For the wider method, see ABM measurement from activity to pipeline.
Key Takeaways
- Account-to-opportunity rate and pipeline per target account, each compared with holdout accounts, are the headline ABM metrics for a board.
- Engagement scores and accounts reached are activity metrics and belong in an appendix, not on the headline slide.
- No credible third-party benchmark exists for a holdout-based account-to-opportunity rate, so each B2B SaaS team has to build its own baseline.
- A holdout needs matched accounts, a frozen list and at least one full sales cycle before pipeline lift is read.
The right ABM benchmark metrics for a board are account-to-opportunity rate and pipeline per target account, each compared with holdout accounts that received no ABM treatment. These two numbers show contribution to revenue. Engagement scores and accounts reached describe activity, so they sit in an appendix. Proving ROI is the top ABM challenge for 47% of practitioners (Demand Gen Report, as compiled by milan-novotny.com, 2025).

The compiler notes that no sample size is disclosed, so read the 47% as directional. It still names the measurement gap this guide addresses.
| Metric | What it shows | Where it goes |
|---|---|---|
| Account-to-opportunity rate | Share of target accounts that opened an opportunity in the window | Headline slide, versus holdout |
| Pipeline per target account | Opportunity value created per account in the group | Headline slide, versus holdout |
| Incremental pipeline | Pipeline above what the holdout group produced | Headline slide |
| Engagement score | Contact activity at the account | Appendix, operating metric |
| Accounts reached | Ad or outreach delivery | Appendix, operating metric |
Account-to-opportunity rate is the share of target accounts that open at least one sales opportunity within a set window. Pipeline per target account is the total opportunity value created by a group of target accounts divided by the number of accounts in that group. Incremental pipeline is the pipeline treated accounts created beyond what matched holdout accounts created.
Boards hear three kinds of pipeline, and they are not interchangeable.
Counting all revenue from target accounts as ABM revenue is a selection effect. Teams pick accounts that already look likely to buy, so the numbers flatter the program. Only the holdout comparison removes that bias. For crediting touches across channels, see ABM attribution.
Engagement scores fail as board metrics because they track contact activity, not revenue from a buying group. Forrester reports that "The typical buying decision now includes 13 internal stakeholders and nine external influencers" (Forrester, 2026). One engaged contact says little about coverage, so scores need proof against opportunity creation before anyone relies on them.
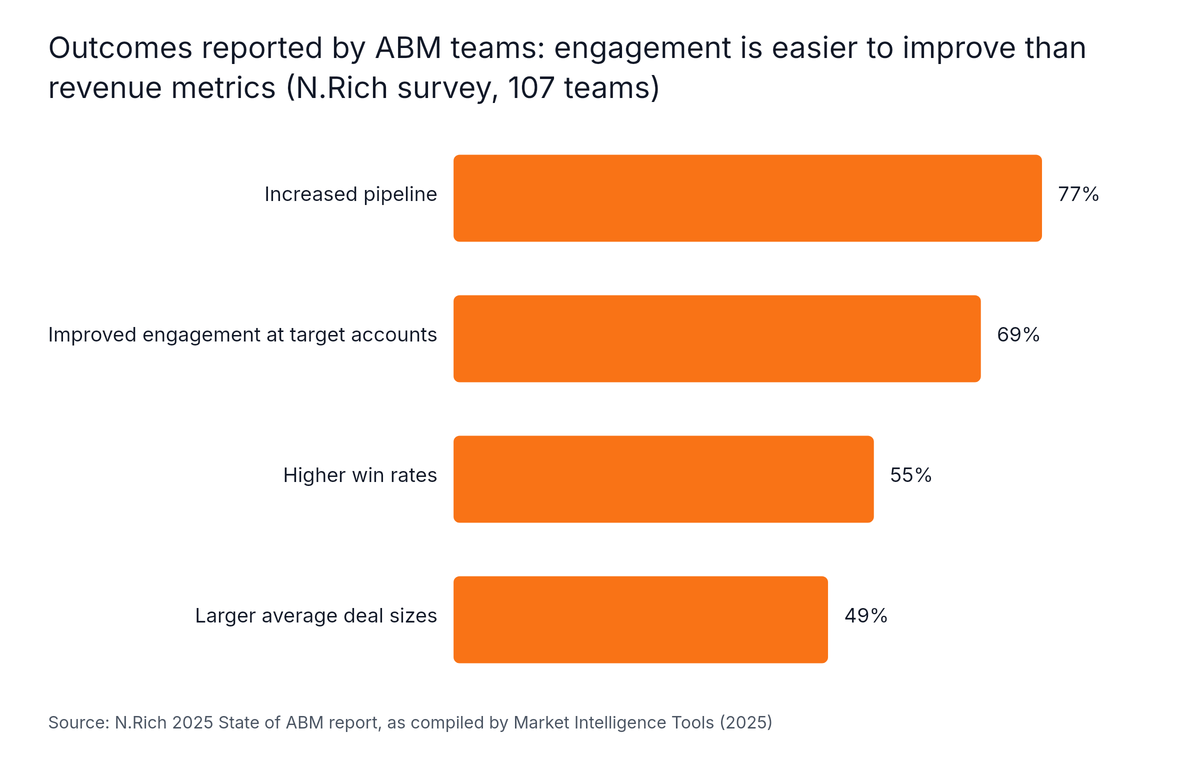
Source: N.Rich 2025 State of ABM report, as compiled by Market Intelligence Tools, 2025
Engagement is the easy win. In a vendor survey of 107 ABM teams, 77% reported increased pipeline and 69% reported improved engagement at target accounts. Only 55% reported higher win rates and 49% larger average deal sizes (N.Rich 2025 State of ABM, as compiled by Market Intelligence Tools, 2025). The survey is self-reported. Still, the pattern is clear: the further a metric sits from revenue, the more teams claim to improve it.
Meet with an expert A free consultation. Bring your target account list and brainstorm the next step with an ABM expert. Meet with an expert
Buying groups keep growing. Forrester finds procurement professionals are decision-makers in 53% of business buying cycles (Forrester, 2026). For purchases that include genAI features, the group averages 14 members versus seven for purchases without them (Forrester, 2026). A score built from clicks by two marketers cannot tell the board whether finance, security or procurement was ever reached.
Targeting adds another distortion. An account can look "engaged" while the people who decide never saw an ad.
Our results: In 56 audited LinkedIn accounts with $9.4M in ad spend analyzed, decision-makers received 33% of LinkedIn ad budget against a target of 60% or more (L26, GrowthSpree, June 2026).
The pipeline gap that follows is covered in why 600 engaged accounts produce zero SQLs.
A score that passes this test is a fair operating metric. It still does not show ABM's contribution, because high-score accounts may have bought anyway.
Holdout accounts prove ABM's pipeline impact by showing what would have happened without the program. Holdout accounts are matched target accounts that receive no ABM treatment. The pipeline per target account gap between treated and holdout accounts, over one full sales cycle, is the incremental result a board can trust. Holdout testing is not among the headline measurement methods; multi-touch attribution leads at 51% (Gather, 2026).

Gather's survey covered 114 B2B marketing leaders, so treat it as directional. Most advice stops at "use a control group." A usable design makes six decisions before spend starts.
| Decision | Approach | Reason |
|---|---|---|
| Eligible accounts | Only accounts that pass the same ideal customer profile (ICP) fit filter and sit in the same account tier | Mixed tiers make the groups incomparable |
| Matching | Pair accounts on tier, firmographic fit, deal-size potential, region and current pipeline status | Keeps treated and holdout groups alike |
| Assignment | Randomise within each matched pair, then freeze the list | Prevents cherry-picking after the fact |
| Contamination | Exclude holdout accounts from ads and ABM sequences; log any sales contact | Protects the comparison |
| Duration | At least one full sales cycle | Pipeline cannot appear sooner than the cycle allows |
| Group size | Agree with finance up front; no published minimum exists | Small groups give noisy results |
Group size is where honesty matters. No source in the verified research sets a minimum, so any quoted threshold would be invented. Published ranges suggest small teams should run lists of 100 to 300 target accounts, while common lists run 500 to 2,000+ (ABM26, GrowthSpree, June 2026, practitioner view, no sample stated).
Calculate both headline metrics for each group, then subtract. Report the gap as a range, not a single point, when groups are small. Sales coordination decides whether the test holds: if sellers quietly prioritise holdout accounts, the comparison collapses. Agree the rule with the sales leader before launch.
Few ABM benchmark numbers are safe to quote, because most publishers disclose no sample and none publish a holdout-based account-to-opportunity rate. Usable figures are directional: a funnel baseline, survey outcome rates and ROI ranges. For example, Forrester's global survey found 23% put ABM ROI 51% to 200% above other marketing (Forrester, via milan-novotny.com, 2024). Build your own baseline for the metrics that matter.

Part of the problem is definition. Nearly 20% of organisations have yet to define what ABM means (Forrester 2024 State of ABM, as compiled by milan-novotny.com, 2025). If a company's "ABM-influenced" pipeline is simply all enterprise pipeline, its numbers cannot be compared with another company's.
| Figure | Value | How to use it |
|---|---|---|
| Enterprise ($1B+) funnel, SQL to opportunity | 36%, versus 40% for small business (First Page Sage, via CompaniesHistory, 2026) | Funnel baseline only; agency data, not ABM-specific |
| Enterprise ($1B+) funnel, opportunity to close | 31%, versus 46% for small business (same source) | Sets expectations for late-stage conversion |
| ABM ROI above other marketing | Most common answer 21% to 50%; 23% said 51% to 200% (Forrester, 2024) | Realistic range for lift claims |
| Teams reporting higher win rates | 55% of 107 surveyed (N.Rich, 2025) | Shows revenue gains are less common than engagement gains |
| Measurement methods in use | 51% multi-touch attribution, 36% marketing mix modeling, 32% spreadsheets, 28% CRM-native reporting (Gather, 2026) | Small sample, multi-response |
None of these is an account-to-opportunity benchmark. They frame expectations, not targets. Widely repeated figures with no traceable origin should stay out of the board deck. Which accounts enter the program matters more than any outside number, which is why firmographic data and ICP fit come before measurement.
The first board report after a funding round should state a pre-spend baseline, one headline slide with account-to-opportunity rate and pipeline per target account against holdout accounts, and an appendix for engagement scores. Marketing budgets are flat at 7.8% of company revenue in 2026 (MarketingHelm, citing Gartner, 2026), so each program has to defend its contribution.
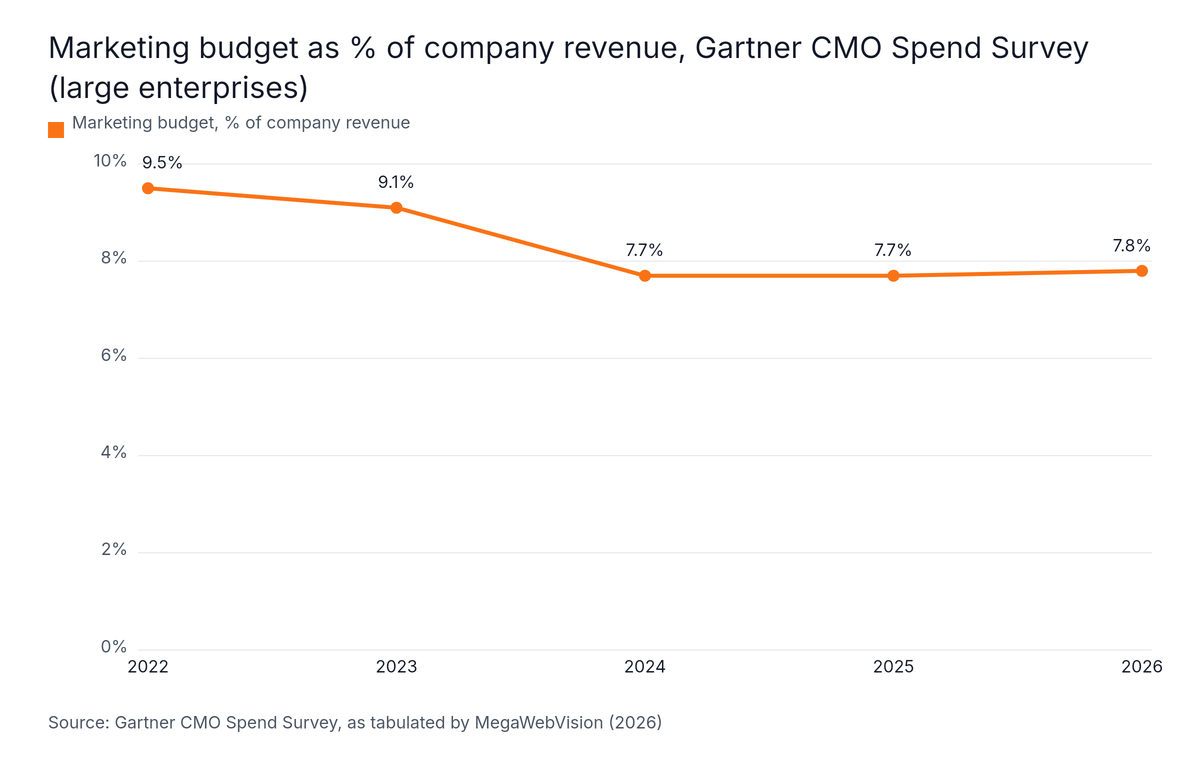
Source: Gartner CMO Spend Survey, as tabulated by MegaWebVision, 2026
Gartner put it plainly: "Marketing budgets remain effectively flat, rising only slightly to 7.8% of company revenue in 2026 from 7.7% in 2025." (Gartner, quoted on GroundedKit, 2026). In the same survey of 401 marketing leaders, 56% said budget is insufficient and 39% plan to cut agency and labour spend (MarketingHelm, 2026). Boards read that environment as a demand for proof.
Forrester describes buyers wanting "A purchase journey that's more rigorous, more collaborative, and far less forgiving of claims without proof." (Forrester, 2026).
| Window | Action | Output for the board |
|---|---|---|
| Days 1 to 30 | Freeze the target account list, agree metric definitions with sales and finance, record the baseline | Baseline and definitions |
| Days 31 to 60 | Launch treatment, keep holdout accounts untouched | Reach and coverage by buying group role (operating) |
| Days 61 to 90 | Validate the engagement score, report early account-to-opportunity rate | Directional lift, flagged as early |
Do not claim pipeline impact before one sales cycle has passed. Published ranges put cycles at 49 to 84 days for $25K to $100K deals, 84 to 126 days for $100K to $250K, and 126 to 180 days for $250K to $1M (BC26, GrowthSpree, 2026, no sample stated). The same ranges show 5 to 8, 7 to 10 and 10 to 15 stakeholders respectively. Larger deals need a longer window and wider role coverage. For how ABM sits next to other programs, see demand generation for B2B SaaS.
The holdout approach to ABM measurement is not for programs with no seller working named accounts or with less than one full sales cycle of data. ABM typically pays when annual contract value (ACV) exceeds $15K and at least one seller works named accounts. Recommended 1:1 tiers run 10 to 50 accounts (ABM26, GrowthSpree, June 2026, practitioner view), too few to split into matched groups.

Other limits apply.
Account-to-opportunity rate, pipeline per target account and incremental pipeline versus holdout accounts show pipeline contribution for B2B SaaS teams running named account programs. Each is counted per account and compared with accounts that received no ABM treatment. Accounts reached, engagement scores and content views show activity, so they stay in the operating report for the ABM team.
A B2B enterprise SaaS marketing team should report two or three headline metrics to the board: account-to-opportunity rate, pipeline per target account, and incremental pipeline against holdout accounts. Definitions should be agreed with sales and finance before spend ramps. Engagement scores and accounts reached go in an appendix as operating metrics for the marketing team.
Pipeline impact shows up in incremental pipeline, meaning opportunity value created at target accounts beyond what matched holdout accounts produced. Account-to-opportunity rate and pipeline per target account are the inputs. Win rate and deal size confirm quality: in a 2025 vendor survey of 107 ABM teams, 77% reported more pipeline but 55% reported higher win rates (Market Intelligence Tools, 2025).
Account based marketing metrics benchmark poorly against outside numbers, because few sources publish a sample and nearly 20% of organisations have yet to define what ABM means (Forrester, via milan-novotny.com, 2025). The sturdier benchmark is internal: a pre-spend baseline plus holdout accounts. Use published figures as direction, such as a funnel baseline, never as targets.
Take two headline numbers to the board: account-to-opportunity rate and pipeline per target account, each against holdout accounts. With marketing budgets at 7.8% of company revenue in 2026 (MarketingHelm, citing Gartner, 2026), proof of contribution matters more than activity counts.
Next step: bring the current target account list and a draft headline slide to a free consultation, and test the holdout design against it. Meet with an expert. For a fuller playbook, read the ABM best practices guide.
Written by
Ishan Manchanda
Ishan Manchanda is co-founder of GrowthSpree, a B2B SaaS marketing consultancy founded in 2017 that has managed $60M+ in ad spend across 300+ B2B SaaS companies. He focuses on demand generation, go-to-market strategy and pipeline growth, and has been featured in Silicon Valley Times, SaaS Mag and the Unbounce podcast.